136 Must-Know Home Services Statistics


Explore essential statistics shaping the home services industry, covering trends, customer behavior, marketing strategies, technology adoption, and more. From market growth to consumer expectations, this data-packed guide provides key insights for businesses looking to stay ahead in a rapidly evolving landscape.


CHAPTER 1
Trends
The home services industry is experiencing significant growth and transformation. This chapter looks at the latest trends shaping the market, from overall spending patterns to projected growth rates across various sectors. Get a comprehensive overview of where the industry is headed and what it means for businesses and consumers alike. Learn more about protecting your growing business with these helpful guides: Electrician Insurance, Plumber Insurance, and HVAC Insurance.
U.S. households shell out an average of $5,000 annually on services.
zipdo.co

Total construction spending in the U.S. reached $1.98 trillion in 2023, a 7.4% increase since the previous year.
Deloitte

Two-thirds (66%) feel optimistic about the direction of the construction market.
KPMG

US Home Service Market size was valued at $90.46 Billion USD in 2023
Verified Market Research

US Home Service Market is projected to reach $156.29 USD Billion by 2030
Verified Market Research

US Home Service Market is growing at a CAGR of 7.1% during the forecast period 2024-2030
Verified Market Research

The U.S. Home Services Industry market value has surpassed $657 billion
Amenify

The global online on-demand home services market size is forecasted to reach $14.7 billion USD by 2030
Grand View Research (via Amenify)

The home improvement market is $475B and grew by 26% in the past year
Angi

The home maintenance market is $105.9B
Angi

The total home service market serving single family houses is $500.2B
Angi

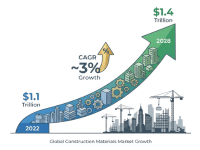
Global construction materials market is growing at a 3% CAGR, projected to reach $1.4 trillion by 2028.
Globenewswire
26% of contractors enjoyed increased revenue in 2022
ServiceTitan

52% of contractors saw profits remain the same in 2022
ServiceTitan

35% of contractors saw increased profits in 2022
ServiceTitan

Employment of grounds maintenance workers is projected to grow 5 percent from 2023 to 2033
Bureau of Labor Statistics

Employment of janitors and building cleaners is projected to grow 3 percent from 2023 to 2033
Bureau of Labor Statistics

Employment of pest control workers is projected to grow 7 percent from 2023 to 2033
Bureau of Labor Statistics

Employment of electricians is projected to grow 11 percent from 2023 to 2033
Bureau of Labor Statistics

Employment of plumbers, pipefitters, and steamfitters is projected to grow 6 percent from 2023 to 2033
Bureau of Labor Statistics

Employment of HVAC mechanics and installers is projected to grow 9 percent from 2023 to 2033
Bureau of Labor Statistics

CHAPTER 2
Customer Behavior
Understanding customer behavior is crucial for success in the home services industry. This chapter explores how consumers search for, interact with, and make decisions about home service providers. From the rise of mobile searches to the impact of customer reviews, these statistics offer valuable insights into consumer preferences and expectations.
Most home services consumers don’t have a company in mind when they run a search.
LSA

78% of local searches on mobile devices lead to a purchase within 24 hours.
ComScore

The pandemic sparked a digital pivot with half of home service pros now doubling down on online marketing.
zipdo.co

More than half of all home service seekers have ditched the desktop — 56.1% now use their phones to look for providers.
zipdo.co

86% of customers read reviews for local businesses

40% of home services consumers who call from a Google search make a purchase

Customers expect responses from companies within four hours

The average company response time is 10 hours

80% of two-income U.S. households are projected to use house cleaning services by 2024
Onedesk (via Amenify)

Approximately 80% of American households are predicted to need handyman services at least once a year
Futuremarket (via Amenify)

Repeat customers accounted for 39% of contractors’ annual revenue
ServiceTitan

71% of last year’s business volume came from word-of-mouth referrals
ServiceTitan

Repeat customers accounted for 39% of annual revenue
ServiceTitan

83% of consumers ranked a factor other than cost as their top priority with an HVAC purchase
WebFX

Over 55% of consumers run a search before scheduling an appointment with a home services business
WordStream

78% of local searches (on a mobile device specifically) lead to a purchase within 24 hours
Podium

90% of customers want to communicate with businesses via text

Podium
77% of customers will leave a review when asked
Podium

98% of consumers now turn to online platforms for information about local businesses
Invoca

CHAPTER 3
Marketing
Effective marketing is essential for home service businesses to stand out in a competitive landscape. Understanding home services marketing and contractor marketing has become crucial for business growth. This chapter covers key marketing statistics, including the costs of digital advertising, the importance of online reviews, and the most effective strategies for attracting and retaining customers Learn how successful businesses are adapting their marketing approaches to reach today’s digitally-savvy consumers. Investing in higher limits can be a nice way to stand out among competition and drive greater yields from marketing efforts – learn about the cost of increasing insurance limits here: Electrician Insurance Cost, Plumber Insurance Cost, HVAC Insurance Cost.
Costs per click (CPC) on Google Ads for certain home services keywords can exceed $40.
WordStream, ACCA, HubSpot

Costs per lead (CPL) for home services often exceed $100.
WordStream, ACCA, HubSpot

Landing new clients is a major headache for 62% of home service companies.
zipdo.co

86% of consumers read reviews for local businesses.
BrightLocal

82% of buyers find review sites valuable in their search.
G2

57% of consumers will only use a business if it has 4 or more stars on local reviews.
BrightLocal

Businesses with an average rating of 4 stars or higher rake in a whopping 32% more revenue compared to those with lower reviews.
Valve + Meter

Approximately 40% of urban households in the U.S. opt for regular, subscription-based home maintenance services
Not specified (via Amenify)

46% of contractors prioritize new customer acquisition
ServiceTitan

32% of contractors who outsource use digital advertising/SEO services
ServiceTitan

56% of contractors aim to increase revenue as a business goal
ServiceTitan

50% of contractors aim to improve customer retention as a business goal
ServiceTitan

46% of contractors aim to acquire new customers as a business goal
ServiceTitan

87% of consumers use Google to evaluate local businesses
WebFX

84% of HVAC customers who perform searches before converting say they didn’t have a particular company in mind
WebFX

80% of consumers use search engines for local queries
WebFX

80% of local searches convert
WebFX

76% of consumers regularly read online reviews when browsing local businesses
WebFX

The average click-through rate for home services search ads in 2023 is 4.80%
WordStream

The average cost per click for home services search ads in 2023 is $6.55
WordStream

The average conversion rate for home services search ads in 2023 is 10.22%
WordStream

The average cost per lead for home services search ads in 2023 is $66.02
WordStream

Construction & Contractors had the highest average click-through rate at 6.25%
WordStream

Plumbing businesses had the lowest average click-through rate at 3.34%
WordStream

Plumbing had the highest conversion rate at 15.61%
WordStream

Construction & Contractors had the lowest conversion rate at 3.65%
WordStream

CHAPTER 4
Technology Adoption
Technology is revolutionizing the home services industry, offering new ways to improve efficiency, customer service, and overall business operations. This chapter examines the current state of technology adoption in the sector, from AI and robotics to smart home integration. Discover how businesses are leveraging these technologies to gain a competitive edge.
44% of construction firms state that AI and robotics will positively impact construction costs by automating manual, error-prone tasks.
AGC

41% say AI and robotics will improve the quality of construction jobs and make workers safer and more productive.
AGC

Over 40% see AI as a potential job stealer, but 97% believe it’ll boost their careers.
WordStream

Smart home technology integration in home services has seen a 35% increase year-over-year
Not specified (via Amenify)

About 66% of contractors consider digital transformation important to their operations
ServiceTitan (via Amenify)

About 30% of contractors have already incorporated artificial intelligence (AI) into their processes
ServiceTitan (via Amenify)

63% of contractors use technology for business management
ServiceTitan

48% of contractors use technology for field service management
ServiceTitan

42% of contractors use technology for accounting
ServiceTitan

33% of contractors use technology for payroll
ServiceTitan

33% of contractors use technology for human resources
ServiceTitan

85% of residential contractors already use at least one business software
ServiceTitan

76% of businesses surveyed currently use two to six software providers
ServiceTitan

Text message open rates are 99%
Podium

Companies with strong omnichannel customer engagement retain 89% of customers, compared to 33% for those with weak engagement.
Invoca

CHAPTER 5
Recruiting and Compensation
The home services industry faces unique challenges and opportunities in workforce management. This chapter provides insights into the current labor market, including hiring trends, salary expectations, and strategies for attracting and retaining skilled workers. For those considering the trades, certain states are experiencing a handyman boom with significant opportunities. Understand the key factors influencing recruitment and compensation in this dynamic sector.
The industry currently faces a skilled labor shortage, with over 50% of home service businesses reporting difficulties in finding qualified workers
Not specified (via Amenify)

Investment in training and certification programs has increased by 25% among home service providers
Not specified (via Amenify)

As of April, the U.S. construction industry had around 440,000 job openings, the highest levels recorded since industry-level jobs data was first collected
Not specified (via Amenify)

38% of contractors will increase technician salaries by 4% or more
ServiceTitan

39% of contractors plan to increase technician pay by 1-3%
ServiceTitan

Increasing enrollment in trade schools, shown by revenue and apprentice numbers, reflects growing recognition of the value of trade careers.
Department of Labor (via Jobber)

The average HVAC tech makes $58,500 annually
WebFX

The 2023 median pay for grounds maintenance workers was $37,690 per year or $18.12 per hour
Bureau of Labor Statistics

The 2023 median pay for janitors and building cleaners was $35,020 per year or $16.84 per hour
Bureau of Labor Statistics

The 2023 median pay for pest control workers was $43,470 per year or $20.90 per hour
Bureau of Labor Statistics

The 2023 median pay for electricians was $61,590 per year or $29.61 per hour
Bureau of Labor Statistics

The 2023 median pay for plumbers, pipefitters, and steamfitters was $61,550 per year or $29.59 per hour
Bureau of Labor Statistics

The 2023 median pay for HVAC mechanics and installers was $57,300 per year or $27.55 per hour
Bureau of Labor Statistics

About 176,600 openings for grounds maintenance workers are projected each year, on average, over the decade
Bureau of Labor Statistics

About 350,300 openings for janitors and building cleaners are projected each year, on average, over the decade
Bureau of Labor Statistics

About 13,100 openings for pest control workers are projected each year, on average, over the decade
Bureau of Labor Statistics

About 80,200 openings for electricians are projected each year, on average, over the decade
Bureau of Labor Statistics

About 43,300 openings for plumbers, pipefitters, and steamfitters are projected each year, on average, over the decade
Bureau of Labor Statistics

About 42,500 openings for HVAC mechanics and installers are projected each year, on average, over the decade
Bureau of Labor Statistics

CHAPTER 6
Operational Efficiencies
Improving operational efficiency is a top priority for home service businesses looking to boost profitability and customer satisfaction. This chapter explores statistics related to customer communication preferences, conversion rates, and strategies for streamlining business processes. Learn how leading companies are optimizing their operations to deliver better results.
Consumers searching for plumbing, appliance repair, and fencing services are most likely to call after making a search.
LSA

40% of home services consumers who call from search make a purchase.
WebFX

Roofing, home remodeling, and deck and patio consumers spend the most when they call from search to make a purchase.
LSA

Callers convert 30% faster than web leads.
Forrester

84% of marketers report phone calls having higher conversion rates with larger order value (AOV) compared to other forms of engagement.
Forrester

85% of marketers believe inbound calls and phone conversations are a key component of their organization’s digital-first strategy.
Forrester

62% of home services customers called during their purchasing journey.
Invoca

18% of home services calls go unanswered on weekdays, while 41% go unanswered on weekends.
Invoca

80% of customers say the experience a company provides is as important as its products and services.
Salesforce

65% of consumers have cut ties with a brand over a single poor customer service experience.
Digiday

32% of consumers say phone calls are the most frustrating customer service channel.
Aspect

38% of consumers will stop doing business with a company if they have a bad call experience.
Invoca

42% of customers prefer a subscription-based service over a one-time service
McKinsey (via Amenify)

Partnerships between home service providers and real estate firms have surged by 40%
Not specified (via Amenify)

27% of contractors have outsourced services to streamline processes
ServiceTitan

76% of contractors who outsource use call centers
ServiceTitan

49% of contractors who outsource use customer service
ServiceTitan

27% of businesses have turned to outsourcing as a solution to streamline their processes
ServiceTitan

32% of contractors who outsource use digital advertising/SEO
ServiceTitan

When front desk staff uses texting instead of phone calls, they can handle up to eight conversations at the same time
Podium

CHAPTER 7
Insurance
Insurance is a critical consideration for home service businesses, impacting both risk management and overall operating costs. Understanding insurance for contractors is essential for protecting your business and assets. This chapter breaks down insurance-related statistics across various home service sectors, including general liability and workers’ compensation premiums. Gain valuable insights into the insurance landscape to make informed decisions for your business.
1.8% of revenue is spent on General Liability insurance for a typical HVAC business
ContractorNerd

1.3% of revenue is spent on General Liability insurance for a typical General Contractor business
ContractorNerd

2.0% of revenue is spend on General Liability insurance for a typical Carpentry business
ContractorNerd

1.7% of revenue is spent on General Liability insurance for a typical Handyman business
ContractorNerd

0.9% of revenue is spent on General Liability insurance for a typical Landscaping business
ContractorNerd

1.1% of revenue is spent on General Liability insurance for a typical Painting business
ContractorNerd

4.1% of revenue is spent on General Liability insurance for a typical Plumbing business
ContractorNerd

0.9% of revenue is spent on General Liabilty insurance for a typical Electrician business
ContractorNerd

$2,235 is the typical Workers Comp premium per HVAC employee
ContractorNerd

$4,780 is the typical Workers Comp premium per General Contractor employee
ContractorNerd

$4,178 is the typical Workers Comp premium per Carpentry employee
ContractorNerd

$4,618 is the typical Workers Comp premium per Handyman employee
ContractorNerd

$1,648 is the typical Workers Comp premium per Landscaping employee
ContractorNerd

$2,611 is the typical Workers Comp premium per Painting employee
ContractorNerd

$2,419 is the typical Workers Comp premium per Plumber employee

ContractorNerd
$1,639 is the typical Workers Comp spend per Electrician employee
ContractorNerd
